How-to: Create a beautiful sparkline in report output
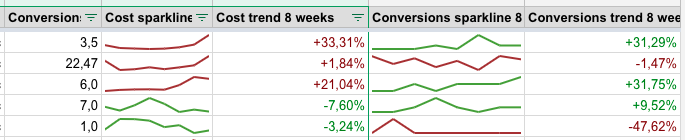
Sparklines are in-cell graphs useful for visualising trends for the past few day/weeks/months. They look like this:
To create these sparklines for a metric, you need 2 additional column in the table:
Trend Data: list or tuple with numeric values of the given metric for the past N time periods (e.g. 8 weekly values for the past 8 weeks)
Overall trend [%]: a single number that express whether the Trend Data is increasing or decreasing in time, and how rapid this change is. This can be calculated using linear regression from the Trend Data.
In the following example, we will create a sparkline for a Ctr metric from table with monthly Campaign performance
data.
First, we have to create a new table with aggregated Trend Data for each Campaign:
import pandas

def create_trend_data(metric_chunk):
    return tuple(metric_chunk)

campaigns_sparklines = campaigns_monthly.groupby(by=[''CampaignId'']).agg({
    'Ctr': create_trend_data,
})
We can now create the overeall trend column in the new table:
from ppc_robot_lib.custom_fields.trends import create_trend
from ppc_robot_lib.reporting.transformation import compute

compute(campaigns_sparklines, {
    'Ctr_trend': create_trend('Ctr'),
})
And, at last, we can create the column with a special
ppc_robot_lib.utils.types.Sparklineobject. This object has to be created with two objects with options:ppc_robot_lib.utils.types.SparklineOptionsthat defines the format of the sparkline, andppc_robot_lib.utils.types.TrendOptionsthat defines the behaviour of the trend - it is used to determine whether the increasing value is a good thing and should be displayed in green, or a bad thing with red color.from ppc_robot_lib.adwords.custom_reports.fields.trends import ( SPARKLINE_COLOR_NO_CHANGE, create_sparkline ) from ppc_robot_lib.utils.types import ( SparklineOptions, SparklineType, TrendOptions, TrendValue ) sparkline_opts = SparklineOptions( type_=SparklineType.LINE, line_width=2.25, color=SPARKLINE_COLOR_NO_CHANGE, use_trend_color=True, ) trend_opts = TrendOptions( better_value=TrendValue.HIGHER_IS_BETTER ) compute(campaigns_sparklines, { 'Ctr_sparkline': create_sparkline( 'Ctr', 'Ctr_trend', sparkline_opts, trend_opts ), }) # Ctr column with trend data is no longer necessary, drop it, # as it might cause trouble when joining the data: campaigns_sparklines.drop(columns=['Ctr'])
The last step: use the
ppc_robot_lib.reporting.transformation.joining.join()to join the newly created table with sparklines to the table with aggregated campaign data.